World Silver Survey 2019 produced for The Silver Institute by the GFMS team at Refinitiv.
Before we go into the report in detail, there are some notable headline points to cover:
- “Physical demand increased 4% in 2018, propelled by a modest rise in jewellery and silverware fabrication, and a jump in coin and bar demand. Indeed, investment in silver bars and coins grew by an impressive 20% last year, driven by an exceptionally strong demand sentiment in India.”
- Industrial fabrication lost 1% last year which slightly reduced its market share from 59% to 56%. Solar Panel demand actually fell slightly for the first time in 3 years mainly the result of excess inventories to be cleared as well as ‘thrifting’ – though this was partially offset by an increase in electronics and brazing alloys and solder sectors.
- “For the third consecutive year, silver mine output fell, declining by 2% last year driven primarily by the lead/zinc sectors.”
Scrap also declined some 1.6% primarily because of the near 8% decline in the silver price, which combined, resulted in “pushing total silver supply for 2018 down by 3%.”
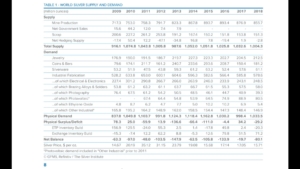
The result of the above places the physical market in a deficit of 29.2 Moz or 908 tonnes which is approximately 3% of annual demand.
So, looking at the chart we can see that total supply results in 1,004.3 million oz against total physical demand of 1,033.5 million oz; providing a physical deficit of 29.2 million oz. Taking into account ETP Inventory Build and Exchange Inventory build the deficit rises to 80.1 million ounces.
Now it has to be mentioned here that such a small deficit should not engender particular excitement, as it falls well within the margin of error when organisations attempt to calculate these figures – however it does provide an interesting trend.
For subscribers generally, the important elements to note are; that coin and bar demand are up nearly 31 million oz (over 20%) – though the figures are still lower than each of the years between 2013 – 2016; and the fall in industrial fabrication of 7.2 million oz (which supports our consistent analysis and commentary that Industrial production levels would be down), and we expect these figures to fall further in 2019 – it is an additional sign in the slowdown of economic growth and therefore the falling demand for silver for industrial purposes.
The LBMA silver price averaged $15.71/oz in 2018 down by 7.8% year on year. Trading took place within a $3.55 range reaching a high of $17.52 and a low of $13.97 oz – to put this in perspective, silver is currently standing at $15.06 oz having opened the year at $15.49.
Silver, analyst Johann Wiebe, told Reuters that:
“Driving the increase was India, where high gold prices spurred many consumers and investors to switch to the cheaper metal silver.”
“India’s consumption of silver jewellery jumped 16 percent to 76.5 million ounces in 2018, while purchases of silver investment bars in India, surged by 160 percent to 69.4 million ounces; lifting global bar and coin investment by 20 percent to 181.2 million ounces.”
He predicts that Industrial Demand is likely to fall this year by about 1%, but would rise again in 2020 and 2021 as production of solar panels picks up and U.S. coin sales expand.
He also said that supply would rise by about 1% in 2019 before falling again in the early 2020s.
Wiebe adds that he expects rising economic and political turbulence, along with a likely weakening of the dollar, to push prices higher, with silver averaging $16.75 in 2019 and $17.50 in 2020.
We generally agree though we suspect that the US dollar may have some more strength left for a little while yet. That said we foresee little reason for any major surge, or collapse, in the price of silver during 2019 and accept that this will present stackers with a further opportunity to acquire during dips and at leisure.


Leave A Comment
You must be logged in to post a comment.